
Workforce has long been the ire of economic development. But while a tight labor market and demographic shifts will only maintain it as economic developers' primary concern, in recent years, housing has been nipping at its heels. After all, what good is having a qualified and skilled workforce if they don’t have a place to live?
Housing is a complex sector impacted by mortgage rates, building costs, and other factors outside a community’s control. But what is in a community’s control is knowing the types of housing needed by their residents now and in the future. Workforce and labor market data from Developer abound to conduct this housing research, create a strategy, and determine necessary actions.
1. Housing characteristics
Characteristics of the existing housing stock are a logical place to start. Using data from the American Community Survey (ACS), we can garner a host of information about the current housing situation: homeowner vacancy rates, median monthly rent, percentage of occupied housing units, and more. And we can drill down all the way to the ZIP or Census Tract level.

Median home value by ZIP in the Denver-Aurora-Lakewood, CO MSA.
This data is often found in different places, such as a local real estate association or compiled through (expensive) housing studies. But much of the information is available in a few clicks in Developer.

Housing data in Denver-Aurora-Lakewood, CO sorted by top five most expensive ZIP codes for median monthly rent.
2. Industry and employment growth
Knowing the types of industries and occupations prevalent in your community can provide insight into the housing needs and preferences of the workforce. For example, if your community has a large number of Accommodation and Food Services workers, then smaller, more affordable housing options may be more desirable.

Largest industries in the Orlando-Kissimmee-Sanford, FL MSA
But that’s only part of the story. Take the Orlando-Kissimmee-Sanford, FL MSA for example. Not surprisingly, Accommodation and Food Services is their largest industry by jobs, followed by Retail Trade. But over the last five years, these industries have each seen a 1% job decline. Over that same time period, Transportation and Warehousing added nearly 19,000 jobs; Professional, Scientific, and Technical Services more than 18,000; and Health Care and Social Assistance 13,000.
In 2022, the average earnings per job in Accommodation and Food Service was $36,394, and $46,786 in Retail. With these industries accounting for roughly 330,000 jobs in the MSA, available housing for this income level is a must.
But communities need to account for not only what they have, but also what they're going to have. In Orlando, the industries that have added the most workers over the last five years have earnings significantly higher than Retail and Accomodation and Food Services.

Top and bottom three industries in the Orlando-Kissimmee-Sanford, FL MSA by 2018-2022 percentage job change
Housing options that are affordable to the majority of the workforce will be more desirable and will help attract new workers to the area. And at the same time, being cognizant of the housing options that cater to where the market is growing will help ensure that growth can be properly accommodated.
3. Household characteristics
The household size of a region provides an obvious window into the type and size of its housing needs. Larger households will desire more square footage in housing. Additionally, if those larger households are families with children, amenities such as parks and playgrounds may also be more desirable.
With more data from the ACS, we can see the average household size—the average count of people in occupied housing units. And also average family size—the average count of people in a family where two or more people are related.

The Community Indicators Map in Developer quickly produces social, demographic, housing, and economic data.
We could also look at median household income or per capita income and analyze those against the housing characteristics (median monthly rent and median house value) from above to better understand affordability.
Furthermore, remote work has been one of the most discussed topics of the last few years, and it has a major impact on housing. Research from the Economic Innovation Group found that people who work from home spend more on their homes and apartments. And homeowners are making the home office upgrade either for themselves or to make their home more enticing to prospective buyers. Remote work adoption trends in a region has become a key housing indicator.
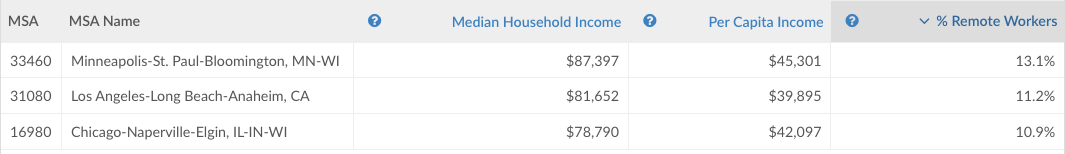
Remote work percentage in three major metros.
4. Population Demographics
Lightcast has researched and written extensively about shifting demographics, with much of the focus on labor market impacts. But population and age demographics will play a major role in housing as well.
The Population Demographics report projects populations by age cohorts, in customized timeframes, and up to ten years out. For example, the San Antonio-New Braunfels, TX MSA has a projected population growth of 11% (284,000 people) over the next decade.
 over the next decade.")
The San Antonio-New Braunfels, TX MSA has a projected population growth of 11% over the next decade.
Within the Population Demographics Table, we can sort the data to get a better sense of who will be driving the population growth. In San Antonio, of the 284,000 projected growth, nearly 117,000 of that population growth is expected to come from the 40-54-year-old cohort. The type of housing sought by a typical person in this cohort and what they are able to afford is much different than the 20-34 year old cohort, which is projected to grow by only 35,500 over the same time period.

The 40-54-year-old cohort in San Antonio is expected to grow by nearly 117,000 over the next decade.
5. Commuting and migration patterns
Understanding the commuting patterns of the workforce can help determine the location and type of housing needed. For example, if the majority of the workforce commutes long distances to work, then housing options closer to major transportation routes may be more desirable.
Develop’s Commuting Map provides inbound and outbound commuter data for a selected region, either by radius or drive time. Using the eight ZIP codes for the city of Spartanburg, SC, we’re able to see that two ZIP codes northwest of the city produce 5,469 and 5,441 commuters each to the city.

Inbound commuters to Spartanburg, SC by ZIP code.
Understanding commuting patterns helps determine the proximity of housing to workplaces and other essential destinations. If a significant portion of the workforce has long commutes, there might be a demand for housing options closer to employment centers.
In addition to the movement within a region, understanding the movement of residents in and out of the region is valuable for informing a housing strategy. Migration patterns provide insights into population movement, demographic shifts, and economic trends. Having a handle on migration patterns helps communities and policymakers make informed decisions about housing development, infrastructure planning, and overall urban growth.
Lightcast uses IRS migration data to track the number of migrating workers within the labor force. This can be done at the state, MSA, or county level. In the case of Spokane County, WA, both inbound and net migration is high from King County (Seattle), WA. Kootenai County (Coeur d’Alene), is also a notable source of inbound migration, but also outbound migration, resulting in net migration of -321.

Spokane County 2020 inbound and outbound migration.
Curious where talent is migrating to?
Checkout our annual Talent Attraction Scorecard.
6. Wage trends
Inflation, increased demand, higher interest rates, and other factors have made buying a home increasingly difficult. Having a pulse on the wages of key industries in a region will shed light on housing affordability for a region’s workforce.
For instance, the largest industry by jobs in Tulsa, OK is Health Care and Social Assistance, with nearly 63,000 jobs. The most common role is Registered Nurses, accounting for nearly 8,000 jobs in the industry. Using Job Posting Analytics, we can see the advertised wage trend for nurses over the last five years has risen from a median of $52,000 in July 2018 to $70,900 in July of this year.

Five-year advertised wage trend for Registered Nurses in the Tulsa, OK MSA.
But while nurses may have more purchasing power, workers in the larger healthcare industry may not. The industry as a whole has seen median advertised wages drop 16.2% during that same time period.

Five-year advertised wage trend for the Health Care and Social Assistance industry in Tulsa, OK.
Housing and economic development
The intricate interplay between housing and economic development has become increasingly evident, making it imperative for communities to delve into comprehensive data points for effective housing research and strategy formation.
Utilizing sources like the ACS empowers communities to grasp critical details about occupancy rates, rent levels, and more. Industry and employment growth reveal connections between workforce composition and housing preferences. The dynamic nature of industries and their changing fortunes over time underscore the importance of adaptive housing strategies.
A successful housing strategy will not only support adequate housing for the workforce, but also align with evolving demographics, preferences, and economic shifts. These data areas are a great place to start in conducting your housing research and developing your strategy.